

We've been busy this year, producing a wide variety of valuable research into marketing and technology, and the key issues that effect marketers. And there's much more to come next year...
But where it's more objective, less subjective, is that the MarTech industry saw a very interesting year. And we've had our fingers on the pulse of all aspects of the space.
So, what have our reports being saying about industry developments, changes, and improvements? Well, let's find out.
The State of MarTech
There's never been a more exciting time to work in marketing and technology. And marketing technology.
But what was the most exciting figure we found? Well, it's this: We estimate the martech industry in North America and the UK to be worth $149.7bn in 2021, and the worldwide market to be worth $344.8bn.
Note: the market for martech and salestech is now worth $509.8bn. See the State of Martech 2022/23 for updated research.
. 
For a relatively new industry, this growth shows the rapid rate in which tech has been applied to every part of marketing, and the need for brands, agencies, and vendors to adapt.
Check out the State of Martech report here! 👈👈
B2B Digital Experience 2021
Waaaaaay before the global pandemic forced people to rethink how they work, play, and communicate, digitisation was leading to massive disruptions in customer behaviour.
Digitisation has provided customers with a wealth of experience, including things to watch, buy, and learn. So, businesses have to adapt. All of this means upending old models of product development, logistics, marketing, sales, revenue generation, and customer experience.
So, what did we find? Well, 77% of B2B buyers state that their latest purchase was very complex, or even difficult. This is worrying, considering the high expectations of customers in the current climate.
This means B2B sellers have to simplify their process, while letting the buyer drive the buying journey. Adapting to buyers’ needs is no longer about thriving in a cluttered and complex B2B marketplace, it’s a requirement to survive.
Check out the report, written in association with ON24, here! 👈👈
2021 CX Trends & Insights Research Report
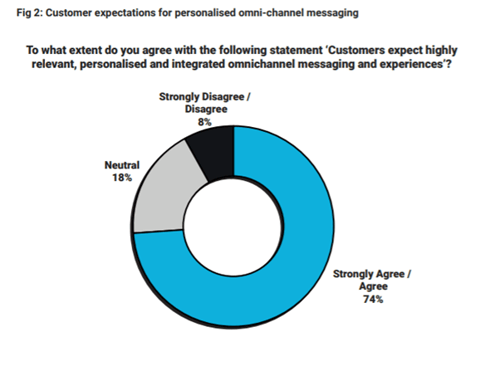
"The world revolves around the customer more than it has ever done before. They don’t go out to the world anymore; they bring the world to them,” says Andrew Stephenson Director of Marketing EMEA & India Treasure Data. So what does this mean?
CMOs understand that customers have increased their expectations of personalised, omni-channel experiences. In fact, 74% of survey respondents agreed or strongly agreed that this was the case, with just 18% remaining neutral and only 8% disagreeing or strongly disagreeing.
Like we've mentioned, the pandemic has accelerated digitisation. In turn, customers have come to expect a frictionless, speedy and exceptional experience.
Check out the report, written in association with Treasure Data, here! 👈👈
The Martech Report 2021/22 (again)
Okay, a second insight from The Martech Report - because it was just that good. We're talking disruptive tech this time.
This is a space that has seen unprecedented growth in the last 12 months, and will continue in the next 12 months. So, what did we find?
AR/VR/ER is currently used by 46% of respondents, with more planning to use these technologies in the next 12 months. This is an area that Facebook has been investing in recently, with CEO Mark Zuckerberg referring to the combination of AR and VR as ‘the next major computing platform’
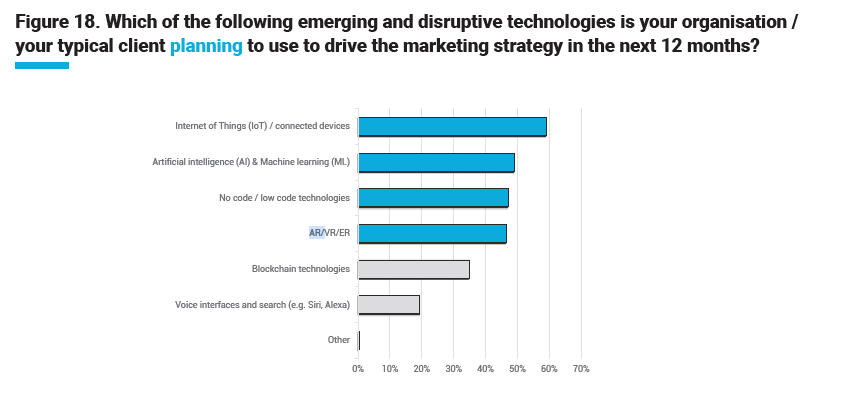
So, there has been a growing focus from marketers on bridging physical and digital experience and making experiences more interconnected.
Check out the report, written in association with MKS, here! 👈👈
The State of B2C Data-Driven Marketing Research Report
Marketers have long known that data leads to insights, and insights lead to customer understanding. But most brands often lack the data marketing skills or knowledge to deliver this..
"We found that while most organisations recognise this, brands often lack the data marketing skills or knowledge to deliver their customer-centric, data-driven marketing vision. Ultimately, brands want to provide customer experiences that matter in every moment, and that means they must not only understand the data and apply the insights, but they have to do it with memory – at every interaction.”
Jochen Toepfer Senior Vice President Professional Services, Acxiom EMEA
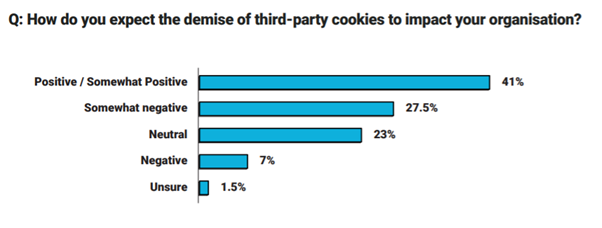
But what's the word (or three) on everyone's lips at the moment? That's right: third party cookies.
We found that more than 40% of CMOs believe the demise of third party cookies will have a positive/somewhat positive impact. Not all marketers believe that the Google announcement regarding the discontinuation of its support of third-party cookies will impact them negatively. In fact, more than 40% believe it will have quite the opposite effect.
This might be a result of more and more alternatives being offered to marketers, alternatives with tangible and clear benefits. Take first-party data for example, which builds trust and enables marketers to improve personalisation, drive greater engagement and ultimately better customer experience.
Check out the report, written in association with Acxiom, here! 👈👈
Your Guide to Customer Data Platforms (CDP) vs Data Management Platforms (DMP)
The age old question: which is better, a CDP or a DMP?
Well, the independent CDP Institute wrote this report to explain CDPs vs. DMPs, how each works, and which is best for a variety of marketing use cases and applications.
The two are often confused with each other, but they are not the same. It’s true that both manage customer data, but have very different purposes, which lead to different technical approaches. Check out our quick-fix guide, here.
So, what did the report find?
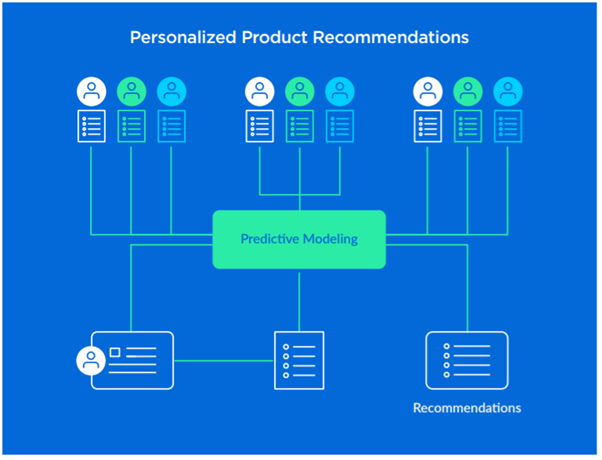
"Your company wants to recommend products to individuals based on products they purchased and other behaviours, such as not purchasing a product they were offered.
To do this, you need to track the behaviour of each customer over time, which means identifying them and keeping a record of every visit. You also need to build a predictive model based on that data.
This is a CDP application. It requires detailed, first-party history data about known individuals and shares its results with multiple systems including Web sites, email engines, call centres, and in-store messaging apps"
Check out the report, sponsored by Treasure Data, here! 👈👈
Website Experience Trends That Are Shaping Online Retail
Uncover the latest website experience trends and some key areas for improvement.
This report, produced in partnership with Siteimprove, used benchmark data from the top 50 online retailers in Australia and New Zealand. Like the entire planet, Oz and Middle Earth saw an acceleration in digital transformation, and a huge online shift from consumers.
Online retail has been growing steadily for a decade, but necessity forced a quicker shift. The potential online market for retailers in Australia and New Zealand is now much larger, and this makes website experience and a strong SEO strategy more important than ever.
So, online retailers need to work hard to match the levels of experience expected by customers.
In July 2021, Siteimprove assessed the top 50 Australian and New Zealand online retailers by search volume, using SEMrush data.
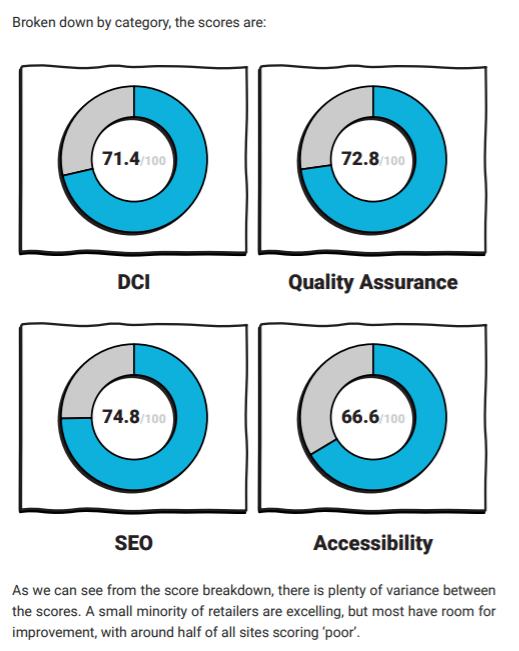
These sites were given scores based on Siteimprove’s Digital Certainty Index™ (DCI). To reach conclusions, Siteimprove measured the quality of the websites to arrive at an overall score for each company, and then for the retail industry. DCI™ scores are calculated based on three categories:
- Quality assurance. A measurement of site experience which covers aspects such as load speed, reduction of errors, and security.
- SEO. How well optimised sites are for search engines. This covers basic on-page SEO and performance measured against Google's Core Web Vitals ranking signals, which crossover into UX and site performance.
- Accessibility. With almost one in five Australians and 25% of New Zealanders living with some form of disability, inaccessible websites could be excluding millions of potential users and customers.
As a result, they found the average score was 71.4.
The benchmark categorises a score between 71-80 as “Medium” which suggests there is room for improvement.
Check out the report, written in association with Siteimprove, here! 👈👈