

Partner Content
In the beginning, there was the funnel, and marketers and salespeople revered it, and it spread across the marketing world because it was a simple way to understand how marketing works. Many potential customers enter at the top; a few buyers trickle out at the bottom. Maximise the number that enters at the top, and barring a leak or two, you can increase how many actually convert.
But the digital transformation of the past several years has changed the way that people interact with marketing. While the funnel still has value as a content strategy tool, these days marketers have far more insight into the customer journey. They understand that the journey is not necessarily a linear, direct path from one end of the funnel to the other. In today’s digital age, the journey can span multiple channels, campaigns, and systems, which makes it difficult for marketers to provide consistent messaging and continuous experiences. Meanwhile, customers want those connected experiences along every step of the journey. They expect personalisation that goes beyond their name slapped onto a form email. And in a world of infinite choices and digital overload, they will take their business elsewhere if their needs are not met.
To build your audience and provide the highest level of personalisation, you need to maximise the value of your customer data. With high-quality data, you can get full insight into customers’ purchase history, see how they align with specific issues and be able to predict their responses to specific initiatives, or next-best actions. Data is key to understanding your customers’ level of loyalty, and how and where they want to engage with your brand. In other words, data can give you full visibility into customer behaviour, across all systems and channels.
Using your customer data to create an omnichannel customer journey map can help you focus your strategy, create more relevant content, and ultimately guide more customers to purchase.
Think of it like a subway map:
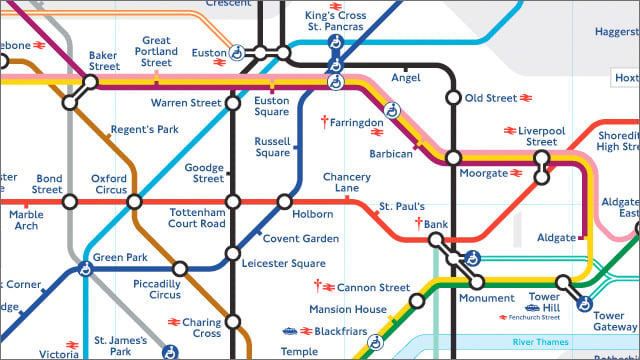
The London Underground Map, also known as the Tube map, is widely considered one of Britain’s design icons. Source: https://www.visitlondon.com
Notice the London Underground map above doesn’t show every twist and turn on the tracks. It doesn’t have every feature, building, or bus route. It’s a useful abstraction to show how the majority of people move through the system.
Here’s how to create a customer journey map that’s unique to your business and your customers. A map like this can help you align your teams and systems to provide value, trust, and continuity for your customers.
How to Create a Customer Journey Map
1. Invite Stakeholders from Across the Organisation
Your map will be a valuable document for setting a marketing strategy. But creating it shouldn’t be a task confined to the marketing department. Your organisation is probably already moving to break down silos, share information between departments, and consolidate data to help shape the customer experience. It’s vital to the future success of the organisation to have departments working together toward shared goals.
]The customer map project is a perfect opportunity to start bringing other departments to the table. The sales department can share details about interactions with prospects, for example. They can talk about frequently asked questions, referral sources, what causes prospects to bail, and more.
Your customer service department can help with statistics on customer interactions, demographics, common complaints, and more. Even the finance department and HR could have data that helps complete the map. And, of course, it’s a good idea to involve leadership, too. They likely have unique insight into the buying process, and it’s good to get their buy-in early on.
When you involve all your stakeholders, the end result is a more comprehensive view of the customer for everyone, not just the marketing department.
2. Tell a Story
At the heart of it, your map should be a narrative. It tells the story of how a particular type of customer encounters your brand and chooses to make a purchase. As you pull together data, keep the story in mind. This template, called “The Story Spine,” is a good way to keep the narrative front and center:
- Once upon a time, there was a ______
- Every day, _______
- But one day, __________
- Because of that, ________
- Because of that, ________ (repeat)
- Until finally, ________
- Every day after that, _____
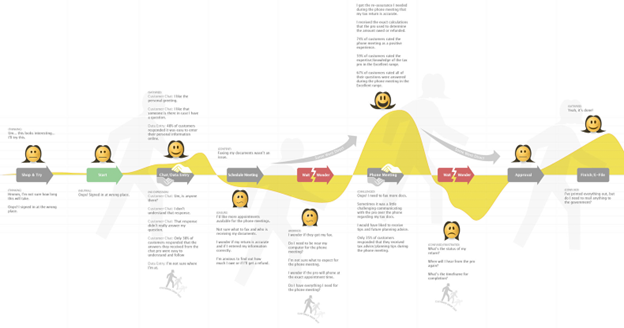
3. The above customer journey map, created for Intuit, highlights various stages of the customer journey.
This map from Intuit is a great example of applying narrative to the customer journey. It tracks the emotional journey as well as the economic one, using emojis to illustrate customer feelings during each phase. It’s easy to see at a glance when customers might be at risk of dropping out.
4. Keep It Simple
As you pull in data and begin to visualise the customer journey, it’s natural to want to capture every single detail. Just remember the goal is to create a useful abstract; an at-a-glance look that hits the key touchpoints. Don’t get bogged down in minutiae or clutter your map with endless branching paths. Stick to a single narrative. If you find there are too many variations to include in a single customer journey, it’s okay to create more than one map. You can divide your customers by persona and create a simpler map for each. Paring down the information will help you focus—the process of elimination will bring into sharp relief what matters most about your customer journey.
For example, compare the map from the previous section with this one:
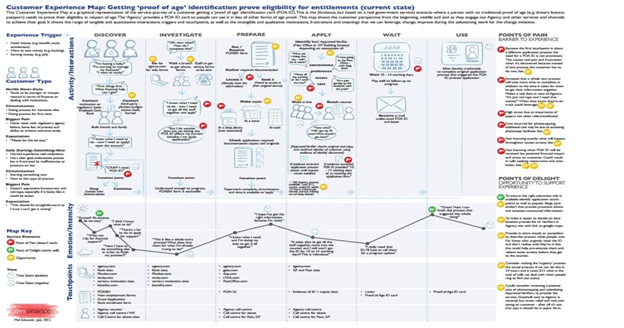
Customer experience maps take many forms. This multi-layered map is jam-packed with information but harder to read at a glance.
The latter has a great deal more information in it, but it loses the at-a-glance immediacy. It can be hard to tell what the biggest priorities are when there’s so much information on display. It’s worth seeing how simple and effective you can make your map.
5.Focus on Key TouchpointsPart of keeping your map simple is to only include the crucial moments where marketing can exert influence. Identify opportunities—times the customer has a need that your marketing can meet. But also look at potential risks, points at which the customer could choose to move on without you.
The sales department can be a great help at this stage. They can provide a wealth of anecdotal evidence on what causes prospects to lose interest and how marketing can help bring them back around. That data can help make your map more precise and also help with sales enablement in the future.
This map from Digital Experiences has an elegant depiction of key touchpoints for a hypothetical hot chocolate store:
This customer journey map clearly outlines where marketing can have the most impact for this hypothetical hot chocolate shop.
This map makes it easy to see exactly when there is the greatest opportunity for marketing to make a difference, how different marketing technologies affect consumer choices, and what marketing’s end goal is for the ideal customer.
6. Make It Visual
The goal should be for your map to be as widely seen in the organisation as possible. As such, it should be pleasing and rewarding to look at. A well-designed customer journey map is equally at home on a PowerPoint slide and hanging on the wall above your desk.
It’s worth having your design team participate in distilling your data into something both visually appealing and easily understandable. Here are three potential templates to work with:
- A fully-designed infographic can convey the information with a creative twist. If you have the design resources, going full visual will help keep the information manageable and consumable.
- A simple table or graph puts the focus more squarely on the data. It’s a good idea to still add some design flourish for visual interest, though (See the example below).
- A grid or flowchart is the most “pure data” version, but it can still be visually appealing (as the example shows).
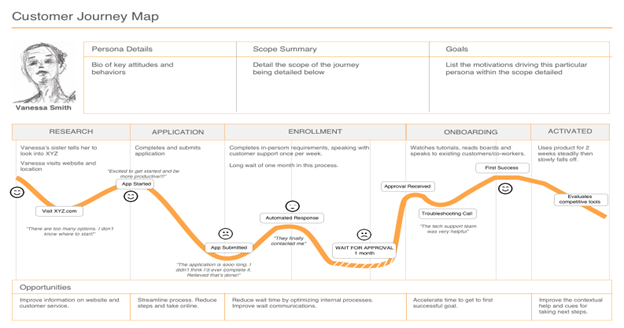
Here is an example of a customer journey map created using a table or graph template.
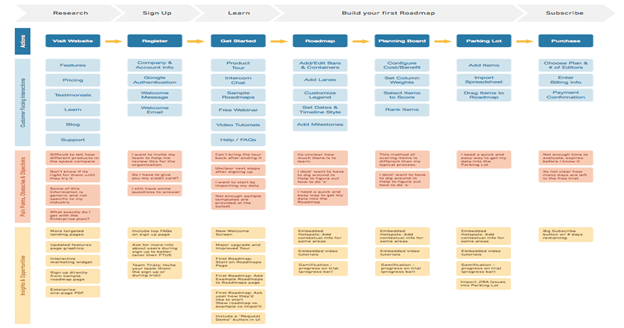
This is an example of how a grid or flowchart can be used to create a customer journey map.
Help Your Customers Reach Their Destination
Moving forward, personalisation will require more sophisticated first-party data. But as your customers’ actions, behaviours, and even privacy requirements change, you need to keep up with changing data. A persistent data disconnect is the enemy of personalisation. Plagued by scattered data in disparate formats, cumbersome processes, and siloed technology, your teams might struggle to track chaotic customer journeys that span multiple devices, locations, or business units.
Treasure Data Customer Data Cloud enables you to responsibly collect, manage, and unify customer data. It allows for deeper insights, giving your customers the right information, at the right time, via the right channel. To further help prevent the data disconnect, we developed Treasure Data Journey Orchestration. Treasure Data Journey Orchestration empowers marketers to connect each omnichannel touchpoint to the relevant context that takes personalisation and conversion to the next level, at scale.
With an easy-to-use interface, Treasure Data Journey Orchestration identifies audiences and their behaviours as they interact with your brand across campaigns, channels, and business units. Pre-built integrations send those insights directly to all your existing campaign tools, giving you a unified view across your customers’ entire journey—from awareness, to purchase and retention.