Partner Content

2020 was a year where digital experiences, from a production and consumption perspective, were thrust into the limelight. While the trend towards the digitization of the buyer’s journey had already been started, the global pandemic accelerated this trend in ways that no one could have imagined.
Overnight, marketers shifted resources from large scale physical events into digital experiences and then readied themselves to have continuous and predictable methodologies to continue to build, drive and deliver digital experiences across the buyer’s journey for the rest of the year.
This report will look at annual and quarterly trends we saw in 2020. We will discuss the overall digital experiences landscape, which includes webinars, on-demand digital experiences, personalized digital experiences and virtual conferences. We will also dive specifically into those types of digital experiences.
The year at a glance
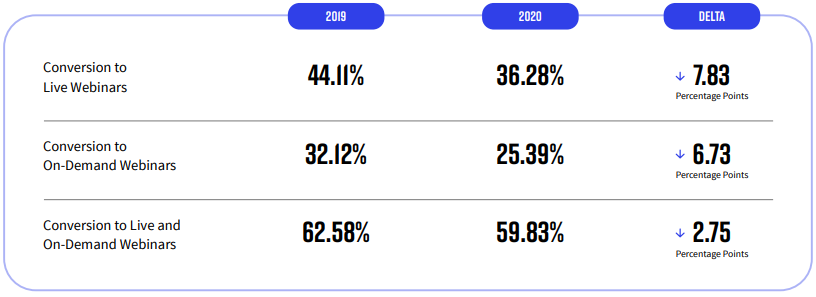
The year over year analysis is fairly unproductive, if not just to drop jaws, when it comes to evaluating digital marketing trends from 2019 to 2020. Not surprisingly, the total number of digital experiences, from webinars to virtual events to on-demand and personalized experiences increased dramatically year over year. While conversion rates dropped slightly, we saw an increase in the average number of webinar attendees and their length of attendance. Even more importantly, engagement in webinars rose dramatically throughout the year, showing the strides towards creating more engaging webinars that marketers made have resonated with audiences.
On-Demand experiences exploded with more marketers adopting this strategy to lengthen the lifetime of their digital experience content.
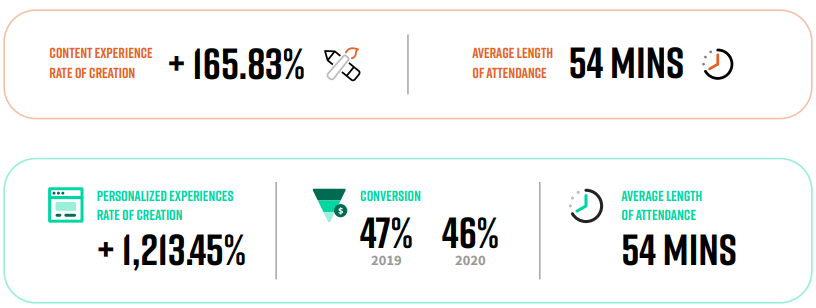
This was also important as people navigated creating bingeable experiences as audiences juggled the demands of home being merged with workday hours. For personalized experiences the increase was dramatic. While COVID was an accelerator, the move to engage with specific accounts, be it for account-based marketing or
renewals started this trend in years prior. An important insight is that even with growth the conversion rate from registration to these personalized experiences to attending the experiences remained the same at a healthy 46.46% in 2020.
160.46%
increase in total digital experiences from 2019 to 2020


QUARTERLY ANALYSIS
This section of the report will focus on the changes from Q3 to Q4. It was no surprise that we saw dips across many categories from Q2 to Q3. This is a season trend we see year over year, as Q3 includes traditionally slower times for marketers, the summer months, and there tends to be a pullback in activity following a busy Q2 events
season. Many of the metrics for audiences and marketers rebounded or exceeded Q2 trends.
This is important because marketers are trying to calibrate their mixes to build for the long term and have an aligned digital-first marketing strategy. The fact that audiences
have become more engaged in digital experiences is a strong signal that b2b marketers must acknowledge and account for in their practices.
While there was growth in many places, there were also places where numbers have stabilized or retracted. This isn’t necessarily a signal for digital fatigue but more for
companies reaching a point of normalized operating in digital marketing. Most marketers spent Q2 and Q3 playing catch up and trying to plug the digital experiences gap that was presented.
Audience
Digital Experience Conversion
There was an increase in overall conversion rates to live or on-demand webinar
experiences, rising to 60.72% in Q4 from 53.93% in Q3. Specifically, the
conversion rates for live experiences rose from 32.86% in Q3 to 35.14% in Q4, and
for on-demand experiences from 23.21% in Q3 to 28.36%.
Attendance
The average number of attendees per webinar experience rose 52.31% in Q4,
an increase and outpaced the average number from Q2 as well.
Attendee Time
Attendees stayed on webinar experiences for an average of one minute longer than
in Q3, rising from 47 to 48 minutes.
Engagement
Questions
The average number of questions per webinar remained steady in Q4 at 16.
This is a drop from Q2 but can be accounted for in marketers taking advantage of
additional engagement techniques in webinars, not relying on Q&A only.
Calls to action
The total amount of calls to action taken by webinar attendees rose
dramatically, 20.11% to Q3 to Q4. This includes downloads of content, poll and
survey responses.
Conversion
There was a significant uptick in conversion actions taken (book a meeting or book
a demo) on the platform by audience members, rising 437.08% from Q3 to Q4.
Content Experiences
Attendance
There was a stabilization of attendance to on-demand content
experiences in Q4, with a slight dip of 3.17% from Q3.
Attendee Length
The average length of attendance saw a dip to 46 total minutes,
down from 55 minutes in Q3.
Content Experience Curation
Marketers continue to leverage video and webinars in these content experiences. In fact, video and webinar content in these experiences rose 14.37% and 21.50% respectively.
Rate of Creation
Marketers continued to turn to the creation of content experiences and created 11.59% more of them in Q4 compared to Q3.
Personalization
Rate of creation
As personalized experiences take time to curate and promote, it was no surprise to
see that the rate of creation of these experiences dropped 37.48% in Q4, as marketers
focused on promoting the experiences that had been created in previous quarters.
Attendees
With attendees to personalized experiences exploding in Q3, we saw a levelling off of
attendees in Q4. With a dip of 20% from Q3.
Conversion Rates
Conversion rates to personalized experiences came in at 45.28%, while lower than Q3
they were higher than in Q2.
Attendance
The average length of time attendees joined personalized digital experiences was
52 minutes in Q4. This is a stabilization of Q3 which was 53 minutes.
Conclusion
Marketers crave data that will help them build their pipelines predictability. Much of 2020 was an anomaly when it comes to evaluating and understanding digital experiences. In these times, we must rely on what we’ve learned from audiences behavior and the key trend here is that audiences are engaging more with us in digital experiences. They are taking more actions within the experiences to download content, ask questions and respond to polls and surveys. They are also taking more actions leaving the experiences, booking meetings and demos, which are the critical buying signals marketers and sales crave. If there are silver linings to glean from the year, these are it.
